Our Water | Source Water Assessment
Freese and Nichols, Inc. was contracted by Cherokee County Water and Sewerage Authority in 2017 to update the Source Water Assessment Plan that was created by Atlanta Regional Commission in 2001. The plan itemized potential sources of surface water pollution to your drinking water supply. Your drinking water is supplied from the Etowah River. A Source Water Assessment is a study and report that provides the following information:
- Identifies the area of land that contributes to the raw water used for drinking water.
- Identifies potential sources of contamination to the drinking water supply.
- Provides an understanding of the drinking water supply’s susceptibility to contamination.
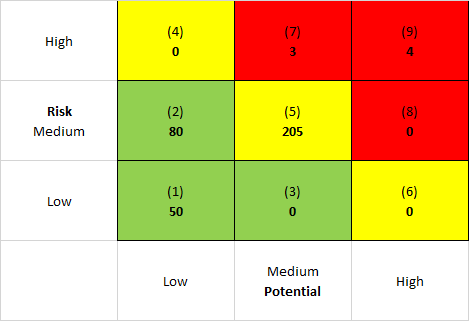
The source data identifies the rankings selected for each source based on risk and release potential. Using this data, the individual sources were plotted in the susceptibility matrix provided.

The susceptibility matrix was color coordinated to better indicate the categories shown within the matrix.
The colors correspond with the potential of pollution where:
- Green boxes (1-3) represent low pollution potential
- Yellow boxes (4-6) represent medium pollution potential
- Red boxes (7-9) represent high pollution potential
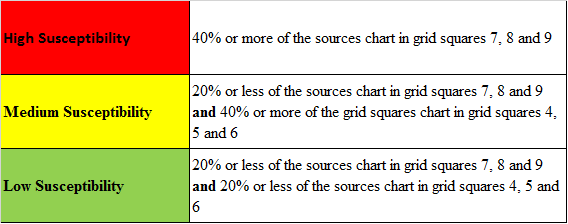
With the individual sources plotted on the prioritization matrix, the watershed’s overall susceptibility to pollution was evaluated based on the Georgia EPD criteria shown in the table to the right.

For the CCWSA’s Etowah River Intakes, the following results were obtained for the 342 individual sources identified:
- 2% have high susceptibility to pollution
- 60% have medium susceptibility to pollution
- 38% have low susceptibility to pollution
Based on these results, individual sources were determined to have an overall medium susceptibility to pollution of the watershed (less than 20% with high susceptibility and more than 40% medium susceptibility). A field review of select individual sources from the inventory was conducted to assess the reliability of the data. Based on the field review, some differences in the inventory were observed. However, the overall susceptibility rating remained at medium.
Summary
The Georgia Environmental Protection Division Source Water Assessment Implementation Plan provides a methodology to determine a source watershed’s susceptibility to pollution by individual and non-point sources. Based on this methodology, the following results were obtained:
- Individual sources were determined to have an overall medium susceptibility to pollution of the watershed (less than 20% with high susceptibility and more than 40% medium susceptibility), with 60% of the sources identified as being medium susceptibility.
- The susceptibility of the watershed to pollution by non-point sources is low, since the total impervious area was determined to be less than 10%. In addition, more than 69% of the watershed was determined to be agricultural or open/forested land use, which has the lowest impervious area of all categories considered.
- Additional sources were determined to have a low susceptibility to pollution of the watershed, with no reported spills in the last 10 years, no railroads immediately within the assessment area, and only three major road crossings within the inner management zone.
Considering the ranking of each potential source, an overall susceptibility rating of the CCWSA’s Etowah River Intakes has been determined to be medium.
For comparison, the source water assessment plan (SWAP) completed by the Atlanta Regional Commission in 2000 also rated the watershed with a medium susceptibility ranking. The 2000 assessment included a total of 210 individual sources compared to 342 with this SWAP. The increase in individual sources may be linked to general population growth and development in the watershed since 2000, with the largest increases in individual sources being fuel facilities (17 in 2000 to 63 in 2017), large industries (increasing from 4 to 36), and National Pollutant Discharge Elimination System permit holders (increasing from 9 to 105). In contrast, the number of agricultural facilities has decreased from 85 to 8 since 2000. The total impervious area has also increased since 2000 from 3.2% to 9.7% in 2017. Though the overall analysis of the watershed provides a susceptibility ranking of medium potential to pollution, CCWSA’s treatment efforts for drinking water are sufficient given that there are no violations per the 2020 Water Quality Report. A copy of the current report is available at this link.

